Si Jobling is an Engineering Manager at ASOS with 20+ years of experience in tech leadership. His career has grown from software engineering and product design to leading large teams across large organizations. He is dedicated to growing others, creating content about frameworks and coaching, and building passionate communities of subject matter experts.
When I transitioned to management after 15+ years as a software engineer, I started to think more critically about team health. I wondered to what extent engineers enjoyed their work and collaborated effectively – and how I might capture this information at a regular cadence. To dig deeper into these questions, I tried a few different tools and frameworks.
Spotify, for example, developed a quarterly health check that measures how teams are doing across 11 dimensions. These range from “health of codebase” to “teamwork” and “fun.” Team members give each dimension a rating of green, yellow, or red. The results are captured on a whiteboard and used to guide discussions around how the team can improve next quarter.
This model yields valuable data. But I craved more frequent updates, especially once my workplace went remote. To support my teams in this new way of working, I developed a simple mechanism to gather quick, consistent feedback in remote settings. The resulting model, PETALS, measures team health on a weekly basis across 5 dimensions:
- Productivity
- Enjoyment
- Teamwork
- Learning
- Stress
Since implementing PETALS, we’ve been able to identify concerns and make improvements much faster than we could with quarterly health checks. My goal is to bring this model to the software engineering community so that we can all build more effective teams.
Today we’ll cover:
PETALS: How it works
The PETALS model is designed to capture feedback on a weekly basis using tools that are already part of your workflow. As an example, my teams currently use Microsoft Forms and Excel. Slack or Teams bots in a group channel could also be successful.
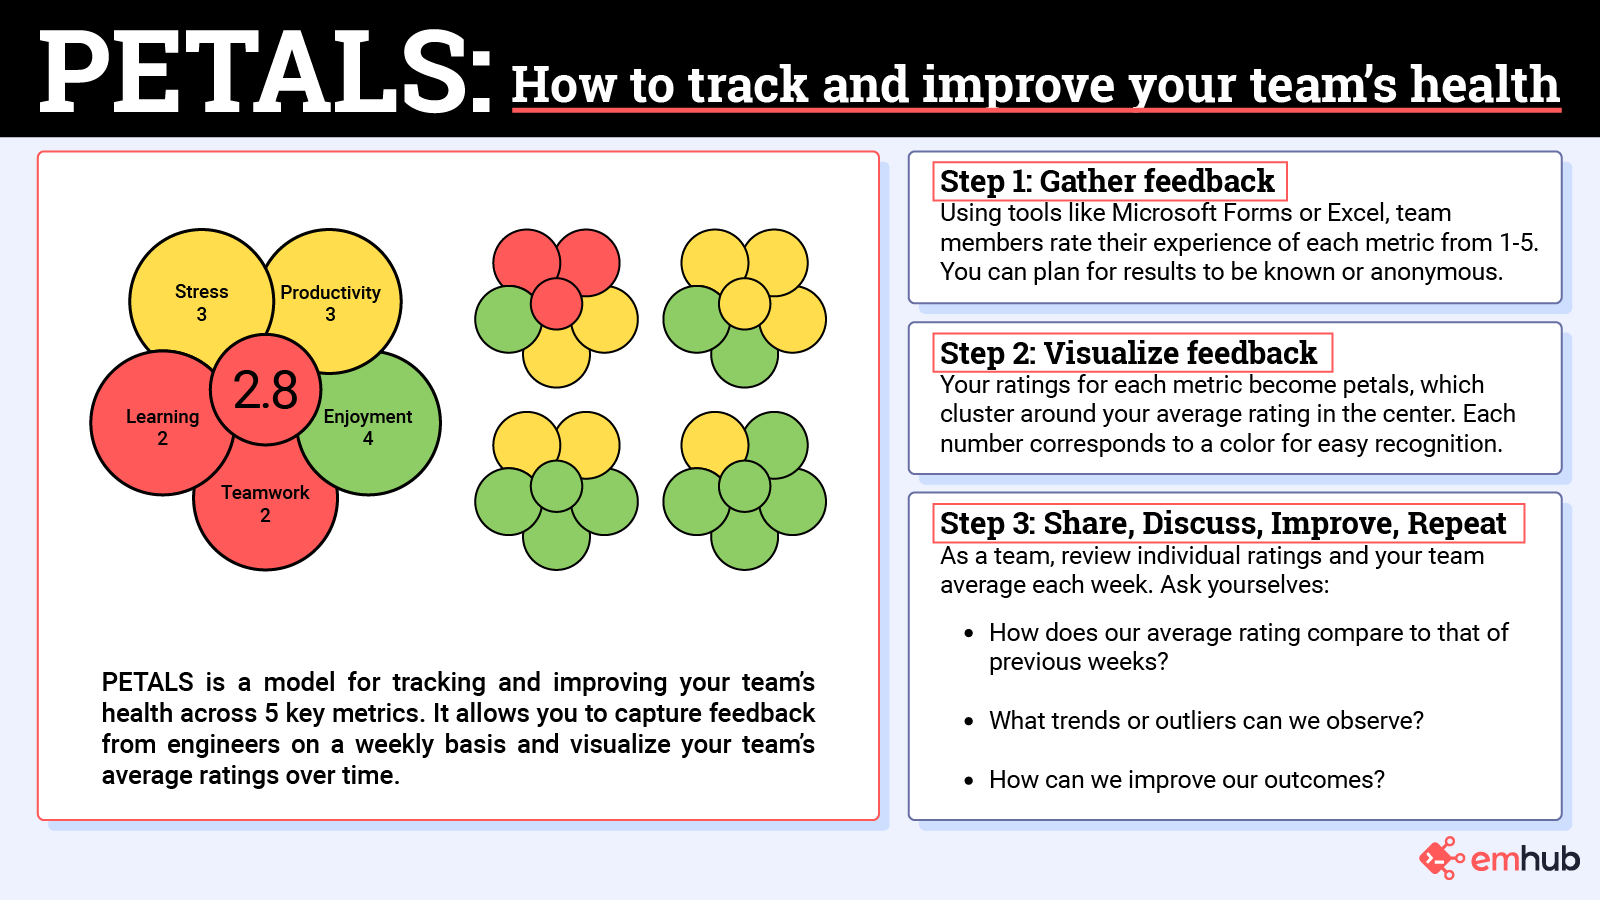
Step 1: Gather feedback
Starting with feedback tools, team members rate each dimension from 1-5 (e.g., How productive have you been this week? How much have you enjoyed your work this week?). Depending on the team, you can plan for results to be known or anonymous.
Step 2: Visualize feedback
This is where the visuals come in. Your ratings for each dimension become petals, which cluster around your average rating in the center. Each number corresponds to a color from a customizable palette. For easy recognition, we use a traffic light system (1 is red, 3 is yellow, 5 is green).
Step 3: Share, Discuss, Improve, Repeat
We like to provide team members with their individual flowers as well as the flower representing our team’s average rating for the week. Over time, this enables us to observe trends and outliers in our individual employee and team health. From there, we can discuss the results in retrospectives and make plans to improve outcomes.
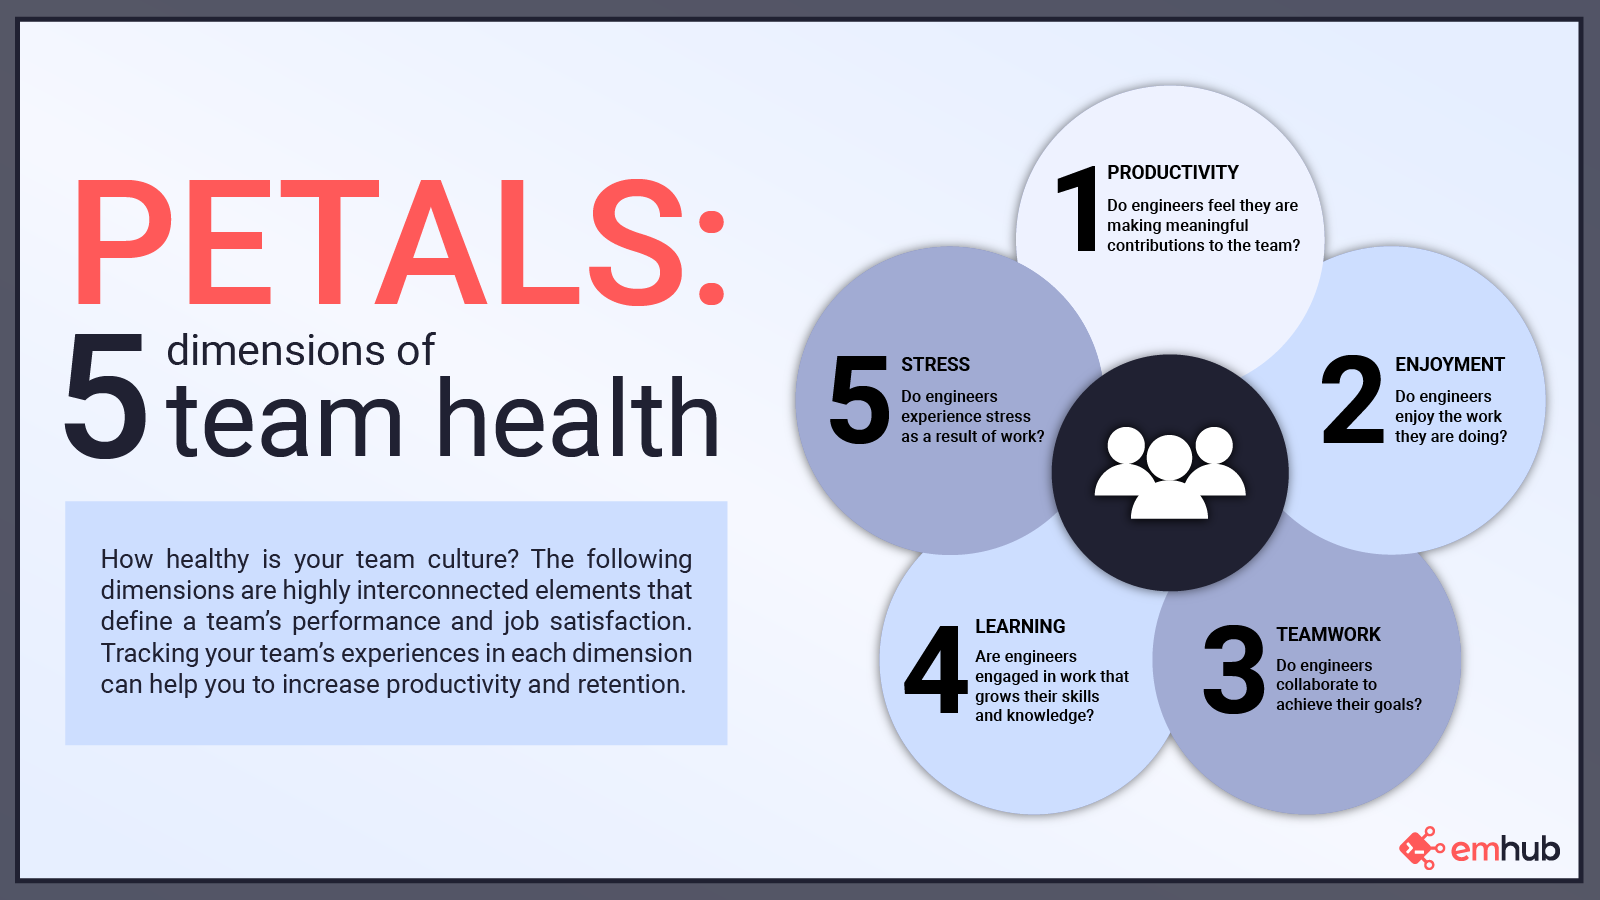
5 dimensions of team health
I’ve spent a lot of time contemplating what constitutes a healthy team. Based on my 20+ years of experience in tech, I selected the 5 dimensions that I think are most important. I do think these dimensions could be modified or expanded according to the needs of your team. For example, I’ve considered adding “autonomy” as the “A” in PETALS. However, starting with these core 5 metrics helps to keep the data manageable yet still highly valuable.
As we explore each dimension, you’ll see that I selected the petals analogy for a reason. Just as petals in a flower overlap, the 5 dimensions are highly interconnected elements of a team’s experience.
Let’s break down the value that each dimension provides within the PETALS framework.
Productivity
When it comes to measuring productivity, there are obvious metrics to pull: for example, number of user stories delivered or how long it took to complete them. However, Scrum and Kanban metrics don’t always align with an individual’s internal sense of productivity.
For example, let’s say output is high on paper, but the output was a load of admin. If individuals don’t find the work especially fulfilling, they might feel as though they haven’t been productive.
Within PETALS, productivity isn’t about quantifying output. It’s about capturing an instinctive response to the question: how productive do you feel you’ve been in the past week?
As you collect data over weeks and months, you’ll learn whether this lack of fulfillment is a persistent problem, or just the result of occasional upticks in less inspiring business tasks. Similarly, if self-reported productivity is high, but external metrics tell a different story, it may be a sign of misalignment between the team’s work and business goals.
At the end of the day, the business wants to know that engineers are delivering value. Productivity ratings, alongside external metrics, can help you to uncover your team’s true feelings about their output. With this knowledge, you can take steps to ensure that employees have the support they need to be productive. Ideally, the next 4 dimensions feed into and enable productivity.
Enjoyment
When you measure your team’s enjoyment of the past week, there are a number of areas you may be capturing:
- Enjoyment of the work
- Relationships with colleagues
- Work-life balance
Enjoyment ratings are highly subjective and likely the result of many factors. However, gathering data weekly means that you can more easily correlate enjoyment with recent work events. Perhaps enjoyment is high because your team had great fun participating in a team-building activity last week.
If enjoyment dips or rises, take a look at the other dimensions and explore potential overlap. There may be more obvious correlations, such as high stress (which appears as a lower rating) and low enjoyment. There may also be less obvious correlations, such as high teamwork and low enjoyment. In that case, consider your team’s working relationships: are engineers working together frequently, but struggling to communicate?
The PETALS visualization can also be useful for tracking your enjoyment as an individual employee. Let’s say that over the past few weeks, you have reported enjoying work more. You may realize that this is due to changes in personal habits, such as finding a healthier working rhythm. By tracking your own “employee health” alongside team health, you can begin to identify variables in your life – which your manager may or may not know about – that help you to be happier at work.
Enjoyment will always fluctuate due to myriad factors, both personal and work-related. But if the team is relatively happy (3-5) a lot of the time, you know you’re in a good place. Frequent ratings of 1-2 should prompt deeper examination of employee experience.
Teamwork
Focusing on individual productivity can lead to unfair comparisons: this person delivered 5 pieces of work in two weeks, while this person delivered the same output in 1. Quantity isn’t the whole story here. Individual output ebbs and flows for all sorts of reasons. Plus, even when you raise pull requests or code reviews, you can’t accurately measure the quality of the work.
I included teamwork in PETALS because productive, healthy teams are able to triage problems and find solutions together. When someone is getting bogged down in the weeds, you want them to be able to turn to a colleague and feel they’re part of a team. While there is value in looking at an individual’s contributions, you don’t want to create a culture that prioritizes the amount of work done over creative problem-solving.
At the same time, employees should have the autonomy to determine how they do their work. While mobbing and pairing might be effective in one situation, tackling the problem individually might work best in another. The important thing is that your team is empowered to collaborate when it serves the project.
Learning
I’ve worked in environments where teams are getting work done, but aren’t growing their skills or understanding at all. Ultimately, I wouldn’t say these teams are healthy. Ticking boxes may keep you afloat in the moment. But if you don’t balance completing work with exploring new ways of doing things, you miss out on opportunities to innovate.
Ideally, team members are able to learn on the job. Instead of saying, “I know this,” they have space to ask, “Do I know it well? Is there a different way to get this done?” The teamwork rating can be revealing here. When teams collaborate frequently, they are more likely to share knowledge and increase everyone’s learning. In the long run, this benefits your employees’ growth and your product.
There are several ways to increase the learning on your team. You can provide formal trainings, but you can also support employees in pursuing more independent self-learning. To help team members balance getting work done with growing their skills, establish open lines of communication.
Learning: In Action
For instance, an engineer on my team participated in a 3-day external training on secure software engineering. Because the latter days provided less relevant information for our product, the engineer decided to leave the last day out and return to work. In PETALS that week, the engineer reported low learning and low productivity: the workshop wasn’t as fruitful as we’d hoped, and the engineer felt less productive due to their absence.
After a follow-up conversation, the engineer and I determined that the course provided some useful high-level theories, but we wouldn’t be recommending it to other team members with similar learning needs. I realized it isn’t enough for me to carve out time for trainings. I also need to communicate with engineers about their goals and support them in finding meaningful learning opportunities.
Stress
We all experience busy or unproductive weeks that elevate our stress at work. If you are seeing yellow stress levels on your team once a week, month, or quarter, that’s probably not a huge concern. However, if high stress is a recurring theme among engineers, take the opportunity to discuss why. Are you noticing trends in the other 4 dimensions that may impact stress?
While fluctuations in stress are normal, pay attention to sudden changes. Let’s say you’ve had weeks of green, and a team member’s stress petal suddenly turns red. Perhaps there is an obvious cause, such as a team member struggling with a particular piece of work. In that case, you can talk with them about providing extra support or just keep an eye on it in the coming weeks.
Stress: In Action
The cause of stress may not always be readily apparent. I remember one instance where stress appeared worryingly high for one of my engineers: a massive red petal among a lovely bunch of green. The results were anonymized, but I decided to talk with my team about it and ask if anyone felt comfortable explaining. The lead engineer spoke up. It turns out they hadn’t realized I was taking off the rest of the month, and were stressed about the potential impact of my absence.
I saw an easy win here. To address the engineer’s concern, we all communicated our plans for the holiday season and discussed the downstream impacts. Catching this in PETALS enabled me to intervene and solve a problem before it had the chance to grow.
The impact of PETALS
Back in the days of fully in-person work, I could walk in and read the room. Who is actively engaged in meetings and who is more withdrawn? Even unspoken indicators like body language could serve as temperature checks for team health.
In remote settings, you miss out on these informal opportunities to assess how your team is feeling. I found the physical distance to be really challenging. The PETALS model has enabled me to bridge some of that distance; it sheds light on positive aspects of our team culture and alerts me to issues before I might notice them otherwise.
Although PETALS is specifically designed to gather feedback in remote settings, it can add value to any team. Whether you are in-person or remote, there will always be engineers who are more inclined to voice their opinions than others.
I’ve learned that silence isn’t necessarily an indicator of positive or negative experiences. It’s possible that engineers are quiet because they are dissatisfied. It’s also possible that engineers are happy, but don’t feel the need to speak up about it. PETALS helps to capture these insights and paint a fuller picture of what is happening on your team.
How might you adapt PETALS for your organization and team? The model I’ve outlined today is just one iteration. Ultimately, I envision PETALS as a collective project that continually evolves to meet our needs. By sharing your ideas with the EM community, you can help to ensure that team health remains a priority in our changing work landscape.